Traefik Ingress Controller for Docker Swarm Overlay Network Routing Mesh
Table of contents
Intro
This post will cover the problematic topic on how to realize sticky sessions in a Docker swarm overlay network setup.
General
Well the first thing you have to know is, that a deployed Docker stack which starts a couple of containers (services) will usually also start up a overlay network that provides an intercommunication layer for this stack service. At the first sight that may not be very useful if you only have one service in your Docker stack compose but it will become very useful if you have more than one service inside your compose file.
Docker swarm compose
Before we can dive into the problem with the Docker overlay network routing mesh in the case of the need of sticky sessions, we will need some information about the Docker stack mechanism. Before the Docker stack mechanism rose up (roughly before Docker engine 17.x.-ce) there was (and is) Docker compose. If you are not using a Docker swarm, you will still need and use docker-compose when you want to startup a Docker service on your single Docker host. When we talk about Docker swarm, then we are also talking about a greater number of Docker hosts, greater 1. When you need a Docker service started on a Docker swarm, you have to use the command {shell}docker stack deploy{/shell} for example. This command uses the same input yaml-file as docker-compose does, with additional possible configuration commands. You can read more about it here. The actual config language version is 3.0 but newer versions are already in the pipeline as the Docker engine version gets updated.
Docker compose example
The following example shows you a fully working Docker stack compose file, including all relevant information to deploy a Docker stack including an application service and an ingress controller service (based on Traefik).
|
|
You have to deploy this compose yaml file exactly with the command:{shell}docker stack deploy -c compose.yml mystack{/shell}. The reason why you have to do this is explained in the next section. You have to read the next section to understand what is going on here - THE EXAMPLE WILL NOT WORK WITHOUT MODIFICATIONS - READ THE NEXT SECTION. The next section also gives you a lot of background information about the compose details and these details are essential!
Traefik ingress controller
If you want to run the compose file shown above, you have to modify it at one point. The Traefik ingress controller is specified in the lb service section of the compose file and you have to change the placement constraint. If you are running the example on a single Docker host which has Docker swarm enabled, you can delete the whole placement part, otherwise you have to define a valid Docker host manager or leader. You can find this settings between line 41 and 43 of the above Docker stack compose file.
After you may have changed this setting, you can deploy this Docker stack compose file with the following command: {shell}docker stack deploy -c compose.yml mystack{/shell}. You have to use the mystack as service name, because this name is used in line 18 of the Docker stack compose file above. There you see the entry {yaml}- “traefik.docker.network=mystack_net”{/yaml}. The first part is used due to the usage of the mystack name we specified on running the {shell}docker stack{/shell} command. The second part comes from the network section of the Docker compose file which you see between line 47 and line 49.
You can see this naming also, if you run the {shell}docker stack deploy{/shell} command. Here is the full output from the deploy command:
|
|
Now we check if our deployed stack is running. We can check this with the command: {shell}docker stack ps mystack{/shell}. The output is shown as follows:
|
|
OK, this seems like that our stack is running. We have two app containers running from the image n0r1skcom/echohttp:latest, which is a simple image built by us to get basic http request/response information quickly. We will see the usage of this in a second. And furthermore a loadbalancer based on traefik:latest is up and running. As you can see in the Docker stack compose file above, we did not specify any exposed ports for the application containers. This containers are running a golang http server on ip port 8080 but it is not possible to reach them from the outside network directly. We can only call them if we use the deployed Traefik loadbalancer which we exposed on ports 25580 (the port 80 mapping of Traefik) and 25581 the dashboard port of Traefik. See lines 29-31. Now we take a look, if we can reach the dashboard of Traefik. Open a web-browser and point it to the ip address of one of your Docker hosts with the given port, for example http://
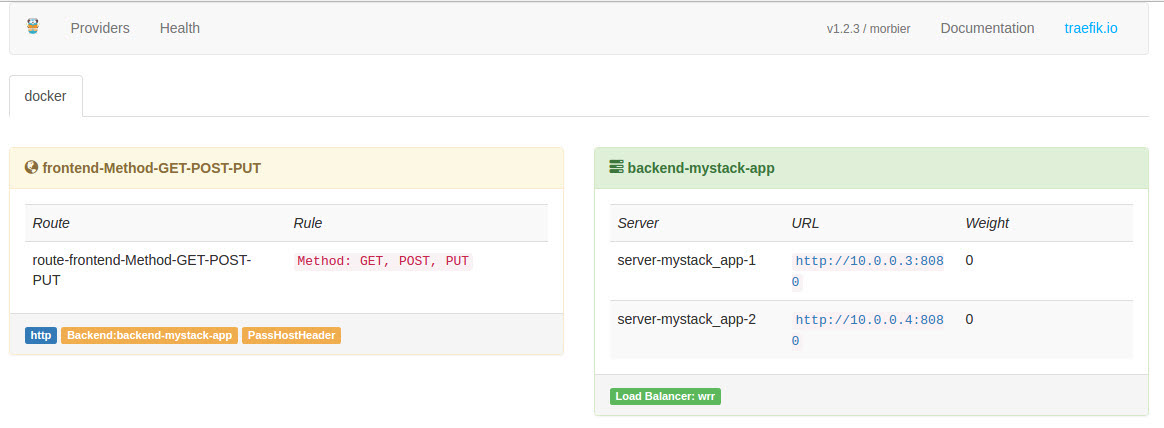
And wow! Now this needs some explanation. First, on the right hand side of the screenshot you will see the backend, that Traefik is using for our service. But wait, where are they coming from. Traefik uses the /var/run/docker.sock Docker interface. This is specified in the lines 32 and 33 of the Docker compose file. This is the reason why the Traefik loadbalancer has to run on a Docker swarm manager or leader because only this Docker hosts can provide the Docker swarm information needed. Furthermore the app containers need special labels. This labels are defined in the lines 16 until 20. There we label our app containers so the Traefik loadbalancer finds them and can use it as backends. To get this working, line number 20 is essential - without this line, Traefik will not add the container as backend! Now all lines of the Docker compose file are explained.
Last but not least we should check if the sticky session based on cookie ingress loadbalancing is working. To do this, open up a browser and enter the URL of the http exposed Traefik port. For example http://
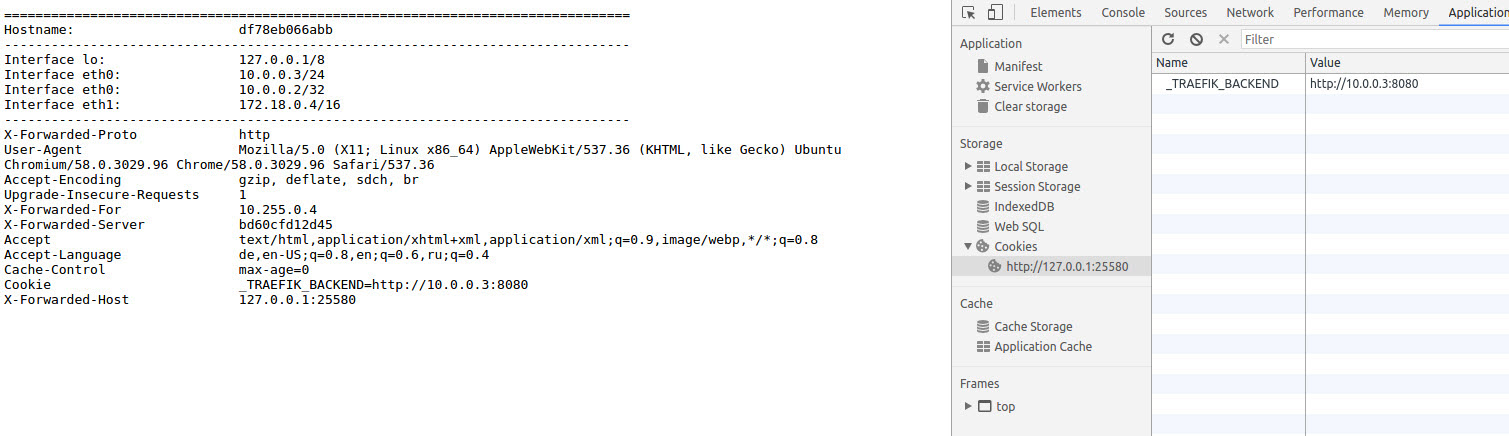
On the left hand side of the screenshot you can see the output from our n0r1skcom/echohttp:latest container. This will show you the hostname from the container you are connected to. In this case the container got the dynamic hostname df78eb066abb and the local ip address of this container is 10.0.0.3. The ip address 10.0.0.2⁄32 is the VIP (virtual ip) from the Docker overlay network mesh. On the right hand side of the screenshot you can see the Chrome developer console, which is showing the loadbalancing cookie we received from the Traefik loadbalancer and this cookie shows that we are bound to the 10.0.0.3 backend. Congratulation! Now you can press STRG+r as often as you like, with this browser session, you are nailed to the 10.0.0.3 backend with this sticky cookie.
You can test the opposite behavior if you use curl, because with curl you will fire a new request every time and you are not recognizing the cookie. Here is the example output:
|
|
As you can see, you are alternating between the started backends. Great! Now we can scale our cluster to, lets say, five backends. This can be done with the command: {shell}docker service scale mystack_app=5{/shell} with the following output including {shell}docker stack ps mystack{/shell}:
|
|
Now we have five backends, we can check this with the Traefik dashboard http://

Congratulations once again! You have dynamically scaled your service and you still have session stickiness. You can check, if all backends are responding via the curl command from above.
Graphic about what you have built
The following graphic shows more than we built today, but we will describe the border controller (loadbalancer) in one of the follow up posts!

Summary
This is the first comprehensive hitchhiker’s guide on Traefik Ingress Controller for Docker Swarm Overlay Network Routing Mesh including sticky sessions. The information shown in this post is a summary of many sources, including Github issues and also a lot of try and (catch)error. If you have any further questions, do not hesitate to contact us! Leave a comment if you like, you are welcome!
 Doing Linux since 2000 and containers since 2009. Like to hack new and interesting stuff. Containers, Python, DevOps, automation and so on. Interested in science and I like to read (if I found the time). My motto is "𝗜𝗺𝗮𝗴𝗶𝗻𝗮𝘁𝗶𝗼𝗻 𝗶𝘀 𝗺𝗼𝗿𝗲 𝗶𝗺𝗽𝗼𝗿𝘁𝗮𝗻𝘁 𝘁𝗵𝗮𝗻 𝗸𝗻𝗼𝘄𝗹𝗲𝗱𝗴𝗲. [Einstein]". Interesting contacts are always welcome - nice to meet you out there - if you like, do not hesitate and contact me!
 CloudArchitect/SysOpsEngineer; loves to get things ordered the right way: "A tidy house, a tidy mind."; configuration management fetishist; loving backups; impressed by docker; Always up to get in contact with interesting people - do not hesitate to write a comment or to contact me!
